A profiler is an analysis tool which measures the frequency and duration of function calls in a software.
Python offers a built-in profiler which provides deterministic profiling of Python program execution. It collects information as a statistic report. This blog post presents how to use the Python built-in Profiler with Aria Automation.
How to Profile Python Actions
The profiling action contains the handler with two inner functions. One that contains the calculation algorithm to be measured, in this example a Fibonacci calculation, and one that invokes it. The handler performs the profiling.
"""
@module de.stschnell

@version 0.1.0

@runtime python:3.11

@memoryLimit 256000000

@timeout 360

@outputType Properties
"""

import json
import cProfile

def handler(context: dict, inputs: dict) -> dict:
    """
    Example action to profile Python code

    @author Stefan Schnell <mail@stefan-schnell.de>
    @license MIT
    @version 0.1.0

    Checked with Aria Automation 8.12.0 and
    VCF Automation 9.0.0
    """

    def fib(n: int) -> int:
        if (n <= 1):
            return n
        return fib(n-1) + fib(n-2)

    def main():
        i: int = fib(40)
        print(i)

    # Main
    cProfile.runctx(
        "main()",
        None,
        locals = locals()
    )

    outputs: dict = {
        "status": "done"
    }

    return outputs
|
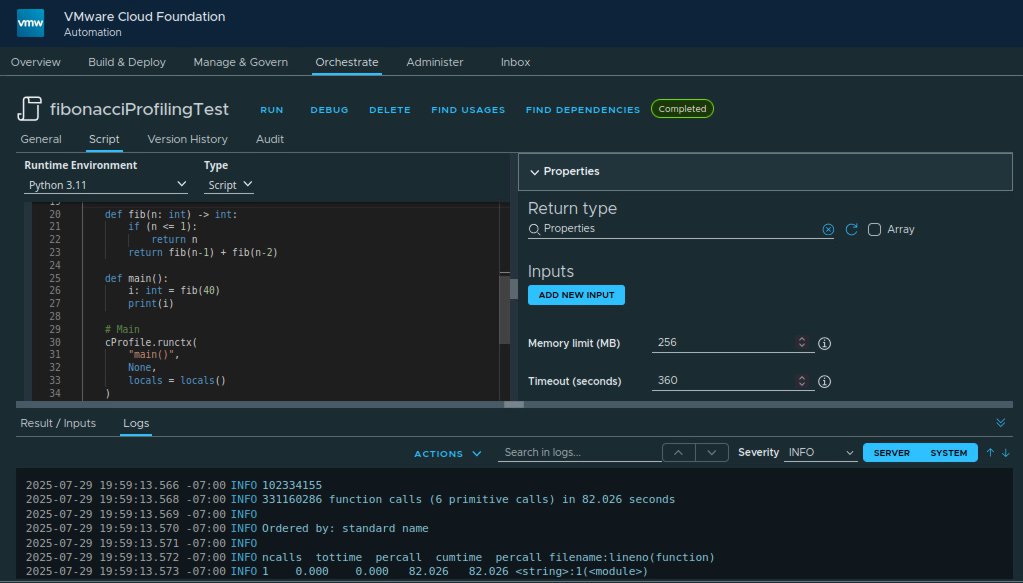
Profiling is performed using the runctx function. It calls the main function which calls the calculation of the Fibonacci number. As can be clearly seen in the result, the fib function that contains the calculation is that one which requires the most effort.
Conclusion
The profiler module implemented in the Python standard library makes it very easy to analyze how often and for how long the parts of a program are executed. This can also be used seamlessly in Aria Automation. This gives us a good basis for using profiling easily here too.