A profiler is an analysis tool which measures the frequency and duration of function calls in a software.
Node offers a built-in profiler which samples the calling stack at regular intervals during program execution. It records the results of these samples as a series of ticks. This blog post presents how to use the Node built-in Profiler with Aria Automation.
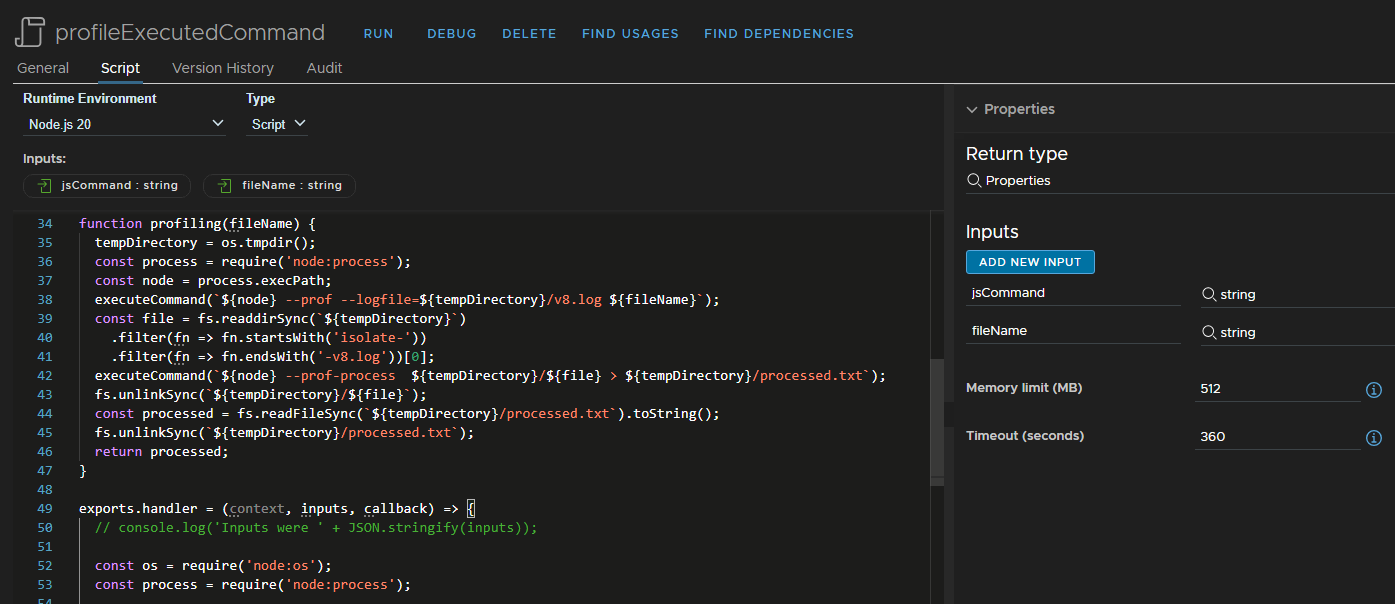
How to Profile Node Actions
The profiling action contains three functions. One that executes the program, one that performs the profiling and the standard handler. In addition to the profiler call, the handler contains several other interesting calls. The trick used here is that another node instance is created that performs the profiling. The files required for this are written to the temporary directory.
/**
 * Node action to profile JavaScript code
 *
 * @author Stefan Schnell <mail@stefan-schnell.de>
 * @license MIT
 * @version 0.1.0
 *
 * Checked with Aria Automation 8.16.2
 *
 * @name profileExecutedCommand
 * @param jsCommand {string}
 * @param fileName {string}
 * @returns {Properties}
 *
 * @example
 * var jsCommand = "console.log(\\\`Hello World\\\`);";
 * var fileName = "test.js";
 * var result = System.getModule("de.stschnell").profileExecutedCommand(
 *   jsCommand,
 *   fileName
 * );
 * System.log(result.status);
 * System.log(result.result);
 */

const fs = require('node:fs');
const os = require('node:os');

function executeCommand(command) {
  const childProcess = require('node:child_process');
  let stdout;
  try {
    stdout = childProcess.execSync(command, {encoding: 'utf8'});
  } catch (exception) {
    stdout = exception.stdout;
  }
  return stdout;
}

function profiling(fileName) {
  tempDirectory = os.tmpdir();
  const process = require('node:process');
  const node = process.execPath;
  executeCommand(
    `${node} --prof --logfile=${tempDirectory}/v8.log ${fileName}`
  );
  const file = fs.readdirSync(`${tempDirectory}`)
    .filter(fn => fn.startsWith('isolate-'))
    .filter(fn => fn.endsWith('-v8.log'))[0];
  executeCommand(`${node} --prof-process  ${tempDirectory}/${file} > \
    ${tempDirectory}/processed.txt`);
  fs.unlinkSync(`${tempDirectory}/${file}`);
  const processed =
    fs.readFileSync(`${tempDirectory}/processed.txt`).toString();
  fs.unlinkSync(`${tempDirectory}/processed.txt`);
  return processed;
}

exports.handler = (context, inputs, callback) => {
  const os = require('node:os');
  const process = require('node:process');

  // Get a few information
  const execPath = process.execPath;
  console.log(`\nNode instance: ${execPath}`);

  console.log(`\nFilename: ${__filename}`);
  console.log(`Current directory: ${__dirname}\n`);

  // Execute JavaScript command
  console.log(
    executeCommand(`${execPath} -e "${inputs.jsCommand}"`)
  );

  // Create JavaScript file
  tempDirectory = os.tmpdir();
  console.log(`Temporary directory: ${tempDirectory}\n`);

  let jsCommand = inputs.jsCommand.replaceAll('\\\`', '"');

  fs.writeFileSync(`${tempDirectory}/${inputs.fileName}`, jsCommand);

  // Execute JavaScript file
  console.log(
    executeCommand(`${execPath} ${tempDirectory}/${inputs.fileName}`)
  );

  // Profiling of JavaScript file execution
  const result = profiling(`${tempDirectory}/${inputs.fileName}`)
  console.log(result);

  // Delete JavaScript file
  fs.unlinkSync(`${tempDirectory}/${inputs.fileName}`);

  callback(undefined, {status: "done", result: result});
}
|
Profiling of a console output via an action of the JavaScript execution environment is shown here as an example.
var jsCommand = "console.log(\\\`Hello World\\\`);";
var fileName = "test.js";

var result = System.getModule("de.stschnell").profileExecutedCommand(
  jsCommand,
  fileName
);

System.log(result.status);
System.log(result.result);
|
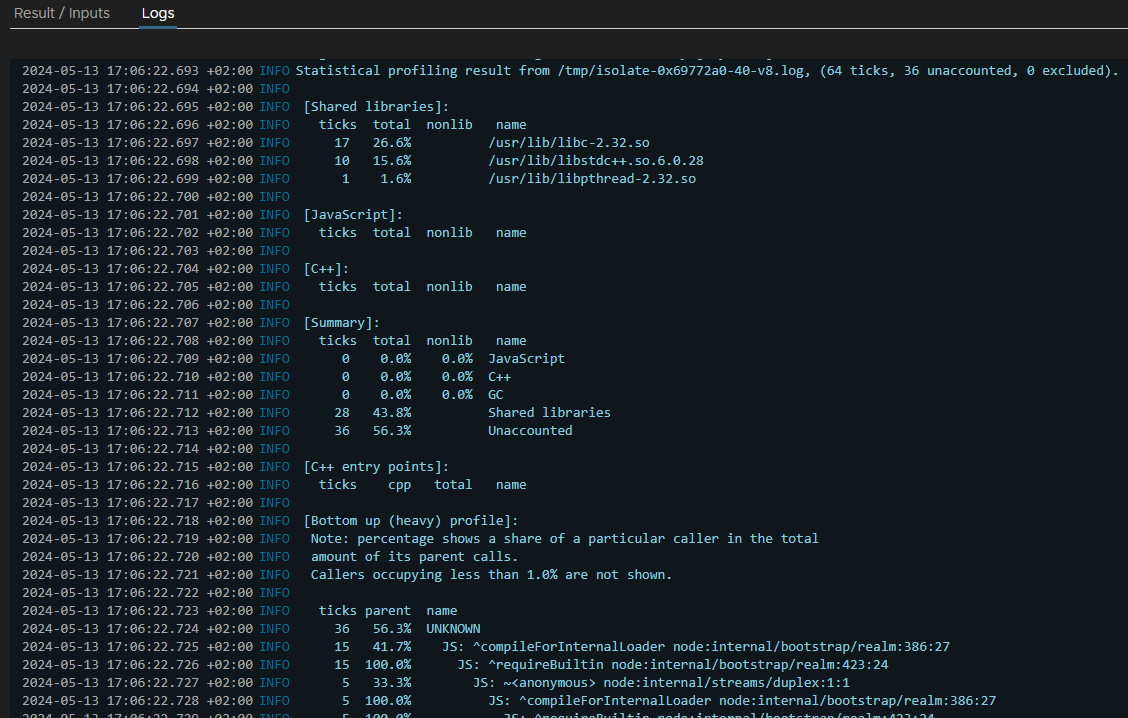
The output in the Aria Automation log shows the profiling results.
Another Example
Of course entire programs can also be analyzed with profiling. The Fibonacci calculation is used in the following example.
var jsCommand = 'function fib(n) { \
  if (n <= 1) { \
    return n; \
  } \
  return fib(n-1) + fib(n-2); \
} \
function main() { \
  const i = fib(45); \
  console.log(i.toString()); \
} \
main();';
var fileName = "test.js";

var result = System.getModule("de.stschnell").profileExecutedCommand(
  jsCommand,
  fileName
);

System.log(result.status);
System.log(result.result);
|
The direct comparison of the ticks between Aria Automation and an emulation environment is very interesting here.
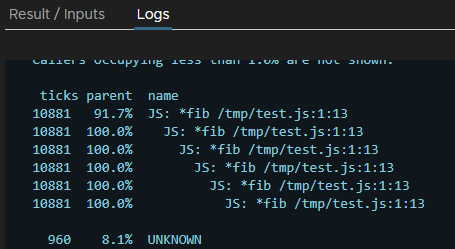
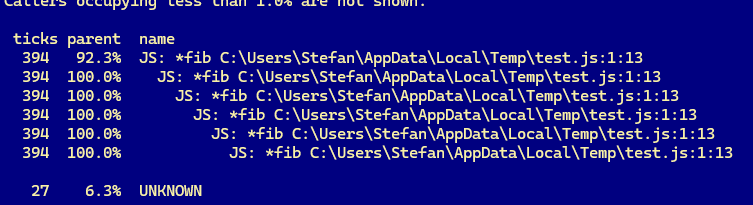
As we can see, the number of ticks, an unit for measuring the internal system time, is considerably higher in Aria Automation than in the emulation environment.
Conclusion
Node actions can be analyzed with profiling in Aria Automation. This gives us the opportunity to observe the performance behavior directly in an environment that is very close to a productive one.